912
Views & Citations10
Likes & Shares
The aim of this study was to compare the dissolution profiles of some commercially available brands of diltiazem hydrochloride and theophylline present on Saudi Arabia market. Dissolution studies for 8 h in pH 6.8 phosphate buffers (900 ml) were carried out on six tablets of each product using USP dissolution paddle at 37 ± 0.5°C and the stirring speed was maintained at 50 rpm. Drug concentration was determined at 236 nm and 272 nm using UV/Vis Spectrophotometer for diltiazem hydrochloride and theophylline, respectively. The kinetics of dissolution for all products used in this study were studied using three different equations, namely, the zero - order, the first - order and the Weibull equations. Also, the lyoequivalency of all products used in this study was tested by dissolution profiles comparison using the similarity factor (f2) and the two one-sided tests (Equivalence test - TOST). Results showed that two out of three commercial products of diltiazem hydrochloride showed zero – order kinetic, while the two commercial products of theophylline B1 and B2 showed first - order kinetic. Results from Weibull equation showed that the shape of dissolution profiles was parabolic (b<1) (case 3) for products A1, A2, B1 and B2 and was sigmoid (b>1) (case 2) for A3. Results obtained from the similarity factor (f2) as well as from the two one-sided tests indicate that all products used in this study have different dissolution profiles, and they were not similar. From the results of this study we strongly recommend that patients using one of these commercial products are not advised to switch on to another commercial product before consultation of their physician, as it may not give the same expected therapeutic response.
Keywords: Dissolution kinetic, Equivalence test, Similarity factor, Theophylline, Diltiazem hydrochloride
Previous studies demonstrated that the similarity factor (f2) and dissimilarity factor (f1) are useful tools to confirm similarity between two dissolution profiles. However, both factors f1 and f2 does not allow point-to-point comparison. Due to this disadvantage, an alternative simple method was proposed called two one-sided tests (Equivalence test - TOST). TOST is an alternative method that can be used to compare dissolution profiles and to provide the time-points that show similarity as well as the time-points that did not show similarity for modified release dosage forms [35].
A change in release profiles from using different commercial dosage forms present on the market for the same drug, such as theophylline or diltiazem hydrochloride, may result in the release of a lower or a higher amount of the drug than the recommended and hence could produce lower therapeutic response or toxic effects [36-38].
The aim of this work was to study the dissolution kinetic and the lyoequivalency (similarity of dissolution profiles) of some commercially available brands of theophylline and diltiazem hydrochloride present on the Saudi Arabia market. The kinetics of dissolution for all products used in this study were studied using three different equations, namely, the zero – order, the first – order and the Weibull equations. Also, the lyoequivalency of all products used in this study was tested by dissolution profiles comparison using the similarity factor (f2) and the two one-sided test methods.
MATERIALS AND METHODS
Materials
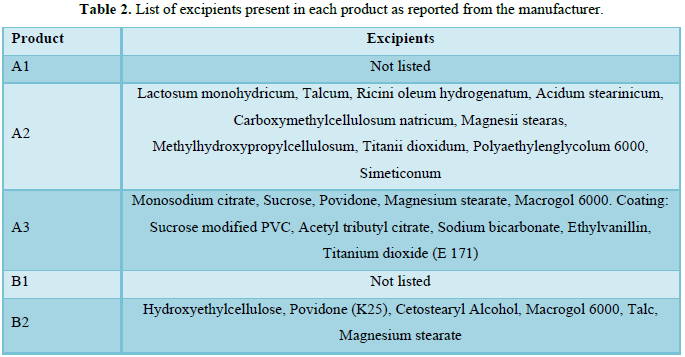
Pure diltiazem hydrochloride and anhydrous theophylline were obtained from Sigma Chemical Co. England. Three brands of diltiazem hydrochloride 90 mg (A1, A2 and A3) and two brands of theophylline 300 mg (B1 and B2) commercially available were purchased from the Kingdom of Saudi Arabia market. All the products were analyzed spectrophotometrically and were found to contain their corresponding label claim.
In vitro dissolution study
For dissolution profiles comparison of all commercial products in this study, we used the two one-sided tests (equivalence test - TOST) as an equivalence test (XLSTAT equivalence test). The dissolution profiles similarity (equivalence) was evaluated by the determination of 90% confidence intervals according to the standard deviations of each time-point of the dissolution profiles. In this equivalence test - TOST (α=0.05), we exclude the null hypothesis and considered the dissolution profiles equivalent when the 90% confidence intervals for the difference were completely included in the predefined range that was considered to be insignificant (± ∆) [35].
RESULTS AND DISCUSSION
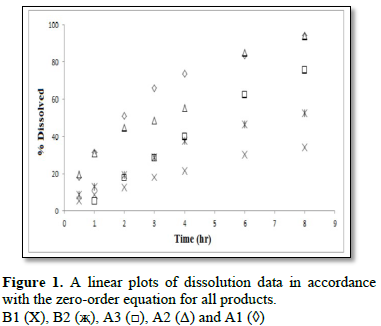
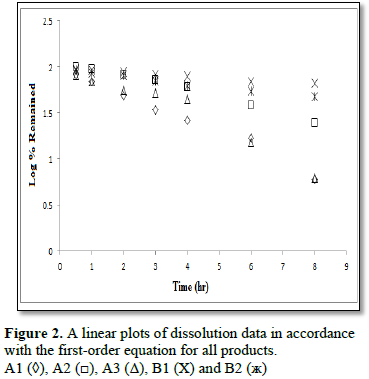
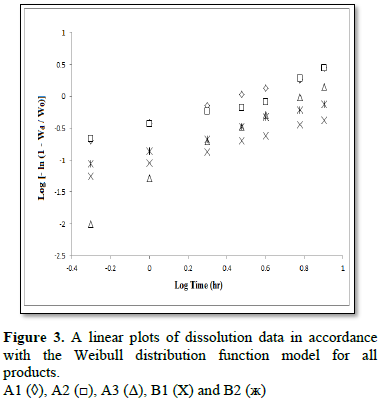
To characterize the dissolution kinetics of diltiazem hydrochloride and theophylline from commercial products present on the Kingdom of Saudi Arabia market three equations were used, namely, zero – order, first – order and Weibull equations. The first order equation and the zero order equation describe if the release of drug from the formulation is concentration dependent or independent. The Weible equation can be applied for all types of dissolution studies and provide very important and useful information about the overall process of dissolution such as the shape of the dissolution profile, the dissolution time and the lag time.
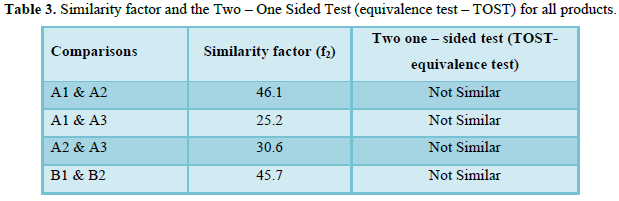
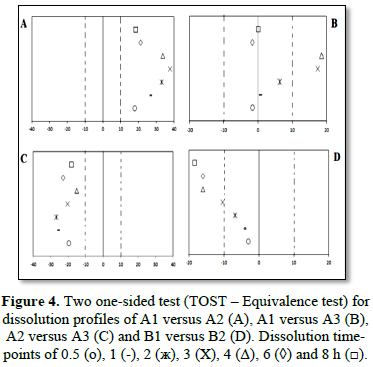
Similarity factor (f2) was calculated for all products used in this study (Table 3). The similarity factor (f2) for A1 versus A2, A1 versus A3, A2 versus A3 and B1 versus B2 was 46.1, 25.2, 30.6 and 45.7, respectively. The values obtained from the similarity factor (f2) indicate that all products used in this study were not similar (if f2<50, dissolution profiles are defined as non-similar). These results were in agreement with the equivalence test - TOST performed for the same products that showed that all products were not similar as shown in Table 3. In addition to the information about the similarity of two dissolution profiles, the TOST helps us to identify the time-points that show similarity as well as the time-points that did not show similarity. This information can’t be provided from the dissimilarity factor (f1) and similarity factor (f2) approach. According to the comparison results shown in Figure 4, the equivalence test - TOST showed that for many points – times there is no similarity. In the comparison between A1 versus A2 and A2 versus A3, we found that the dissolution profiles were not similar in all time points (Figures 4A and 4C). While the results obtained from the application of the two one-sided tests for the comparison between A1 and A3 showed that the dissolution profiles were not similar in 3 and 4 h (Figure 4B). Differences in the point – times were also observed in 3, 4, 6 and 8 h for the comparison between B1 and B2 as shown in Figure 4D.
Analyses of the dissolution kinetic data for diltiazem hydrochloride and theophylline commercial products present on Saudi Arabia market showed that two of three commercial products of diltiazem hydrochloride followed zero – order dissolution kinetic, while the two products of theophylline followed first order dissolution kinetic. Differences between products were also observed in the shape of dissolution profiles and dissolution time due to the method of manufacturing and type of excipients present in each product.
Results obtained from the similarity factor (f2) and from the equivalence test – TOST showed that the three commercial products of diltiazem hydrochloride as well as the two commercial products of theophylline available in the Saudi Arabia market are variant and not similar. It is important to note that products with different dissolution rate will change significantly the rate of absorption into the gastrointestinal tract as well as the level of drug concentration in the plasma and hence could produce a lower therapeutic response or toxic effects. From this study, it can be concluded that patients using either one of these commercial products of diltiazem hydrochloride or theophylline available in the Saudi Arabia market are not advised to switch on to another commercial product of the same drug before consultation of their physician, as it may not give the same expected therapeutic response.
CONFLICT OF INTEREST
The authors do not have any conflict of interest.
1. Sayed A, Adel A, Ahmed A, Omiya H (2016) Design and in vitro/in vivo evaluation of sustained-release floating tablets of itopride hydrochloride. Drug Des Devel Ther 10: 4061-4071.
2. Jain S, Srinath MS, Narendra C, Reddy SN, Sindhu A (2010) Development of a floating dosage form of ranitidine hydrochloride by statistical optimization technique. J Young Pharm 2: 342-349.
3. Chen L, Wang F (2013) Development of sustained-release matrix tablets of BKP-01-041 (tilorone derivative) containing hypromellose. Pharmazie 68: 796-799.
4. Raslan K, Maswadeh H (2011) In vitro dissolution kinetic study of theophylline from mixed controlled release matrix tablets containing hydroxypropylmethyl cellulose and glycerylbehenate. Indian J Pharm Sci 73: 300-302.
5. Ferrero C, Jiménez-Castellanos MR (2014) In vitro release testing of matrices based on starch-methyl methacrylate copolymers: Effect of tablet crushing force, dissolution medium pH and stirring rate. Int J Pharm 30: 270-279.
6. Allahham A, Maswadeh H (2014) Study of dissolution kinetics for poorly water soluble drugs from ternary interactive mixtures in comparison with commercially available capsules. J Pharm Innov 9: 106-114.
7. Turner S, Federic C, Hite M, Fassihi R (2004) Formulation development and human in vitro/in vivo correlation for a novel, monolithic controlled release matrix system of high load and highly water soluble drug niacin. Drug Dev Ind Pharm 30: 797-807.
8. Lauwo JAK (1984) Effect of particle size and excipients on the dissolution rate of metronidazole from solid dosage forms (II). Drug Dev Ind Pharm 10: 1085-1096.
9. Gohel MC, Parikh RK, Brahmbhatt BK, Shah AR (2007) Improving the tablet characteristics and dissolution profile of ibuprofen by using a novel co-processed super disintegrant: A technical note. AAPS Pharm Sci Technol 8: 94-99.
10. Choulis NH, Papadopoulos H (1975) Factors effecting drug release from inert matrices. Part 1: Effects of surfactants on the release of quinine sulfate. Pharmazie 30: 233-236.
11. Paulo, Sousa Lobo JM (2001) Influence of dissolution medium agitation on release profiles of sustained-release tablets. Drug Dev Ind Pharm 27: 811-817.
12. Skripnik KKS, Riekes MK, Pezzini BR, Cardoso SG, Stulzer HK (2017) Investigation of the dissolution profile of gliclazide modified-release tablets using different apparatuses and dissolution conditions. AAPS PharmSciTech 18: 1785-1794.
13. Wadher KJ, Kakde RB, Umekar MJ (2011) Formulation and evaluation of a sustained-release tablets of metformin hydrochloride using hydrophilic synthetic and hydrophobic natural polymers. Indian J Pharm Sci 73: 208-215.
14. Sahoo J, Murthy PN, Biswal S, Sahoo SK, Mahapatra AK (2008) Comparative study of propranolol hydrochloride release from matrix tablets with KollidonSR or hydroxy propyl methyl cellulose. AAPS PharmSciTech 9: 577-582.
15. Ravi PR, Kotreka UK, Saha RN (2008) Controlled release matrix tablets of zidovudine: Effect of formulation variables on the in vitro drug release kinetics. AAPS PharmSciTech 9: 302-313.
16. Chivate AA, Poddar SS, Abdul S, Savant G (2008) Evaluation of Sterculia foetida gum as controlled release excipient. AAPS PharmSciTech 9: 197-204.
17. Chevalier E, Viana M, Artaud A, Chomette L, Haddouchi S, et al. (2009) Comparison of three dissolution apparatuses for testing calcium phosphate pellets used as ibuprofen delivery systems. AAPS PharmSciTech 10: 597-605.
18. Ha JM, Seo JW, Kim SH, Kim JY, Park CW, et al. (2017) Implementation of quality by design for formulation of rebamipide gastro-retentive tablet. AAPS PharmSciTech 18: 3129-3139.
19. Mangas-Sanjuan V, Colon-Useche S, Gonzalez-Alvarez I, Bermejo M, Garcia-Arieta A (2016) Assessment of the regulatory methods for the comparison of highly variable dissolution profiles. AAPSJ 18: 1550-1561.
20. Kasperek R, Polski A, Zimmer Ł, Poleszak E (2014) Release kinetics of papaverine hydrochloride from tablets with different excipients. Sci Pharm 82: 684-696.
21. Mathur V, Nagpal K, Singh SK, Mishra DN (2013) Comparative release profile of sustained release matrix tablets of verapamil HCl. Int J Pharm Investig 3: 60-65.
22. Vueba ML, Batista LA, Veiga F, Sousa JJ, Pina ME (2013) In vitro release of ketoprofen from hydrophilic matrix tablets containing cellulose polymer mixtures. Drug Dev Ind Pharm 39: 1651-1662.
23. Maswadeh H (2016) Dissolution and compatibility study of binary and ternary interactive mixtures of indomethacin: Comparison with commercially available capsules. Acta Polo Pharma 73: 739-748.
24. Dokoumetzidis A, Papadopoulou V, Macheras P (2006) Analysis of dissolution data using modified versions of Noyes-Whitney equation and the Weibull function. Pharm Res 23: 256-261.
25. Paulo C, Jose MS (2001) Modeling and comparison of dissolution profiles. Eur J Pharm Sci 13: 123-133.
26. Maswadeh H (2017) Lyoequivalency, dissolution kinetics and drug-excipient compatibility of some commercially available acetaminophen tablets. J Pharm Res 11: 57-63.
27. Vivek SD, Suprit DS, Nishikant AR, Rahul VH (2015) Excipient variability and its impact on dosage form functionality. J Pharm Sci 104: 906-915.
28. Bozdag S, Subasi B, Vural I, Unlu N, Capan Y (2011) Evaluation of drug excipient interaction in the formulation of celecoxib tablets. Acta Polo Pharma 68: 423-433.
29. Peter N, Choristensen A, Rantanen J, Cornett C, Taylor LS (2012) Disproportionation of the calcium salt of atorvastatin in the presence of acidic excipients. Eur J Pharm Biopharm 82: 410-416.
30. Ritger PL, Peppas NA (1987) A simple equation for description of solute release from swellable devices. J Control Release 5: 37-42.
31. Costa P, Sousa Lobo JM (2001) Modeling and comparison of dissolution profiles. Eur J Pharm Sci 13: 123-133.
32. Jackson K, Young D, Pant S (2000) Drug-excipient interactions and their effect on absorption. Pharm Sci Technol Today 3: 336-345.
33. Wang F, Saidel GM, Gao J (2007) A mechanistic model of controlled drug release from polymer millirods: Effects of excipients and complex binding. J Control Release 119: 111-120.
34. Masudaa T, Yoshihashi Y, Yonemochi E, Fujii K, Uekusa H, et al. (2012) Co-crystallization and amorphization induced by drug-excipient interaction improves the physical properties of acyclovir. Int J Pharm 422: 160-169.
35. Felipe L, Daniela G, Rosa Y, Terezinha P (2013) Comparison of dissolution profile of extended-release oral dosage forms - Two one-sided equivalence test. Braz J Pharm Sci 49: 367-371.
36. Buckton G, Ganderton D, Shah R (1988) In vitro dissolution of some commercially available sustained-release theophylline preparations. Int J Pharm 42: 35-39.
37. Otsuka M, Tomita H, Otsuka K, Kamae I, Jorgenson JA (2006) International harmonization of generic drugs: In vitro dissolution tests for Japanese and American generic tablets. Biomed Mater Eng 16: 129-135.
38. Adetunji OA, Adigun NF, Odeniyi MA (2015) Pharmaceutical equivalent studies of some commercially available brands of Loratadine hydrochloride tablets. Afr J Med Med Sci 44: 269-276.
39. Chavda HV, Patel CN, Anand IS (2010) Biopharmaceutics classification system. Sys Rev Pharm 1: 62-69.
40. Abrahamsson B., Lennernas H (2003) Application of biopharmaceutic classification system now and in the future. In: Waterbeemd HVD, Lennernas H, Artursson P, editors. Drug bioavailability. Weinheim: Wiley Inter. Science, pp: 495-531.
41. Somani AA, Thelen K, Zheng S, Trame MN, Coboeken K, et al. (2016) Evaluation of changes in oral drug absorption in preterm and term neonates for Biopharmaceutics Classification System (BCS) class I and II compounds. Br J Clin Pharmacol 81: 137-47.
42. Brouwers J, Ingels F, Tack J, Augustijns P (2005) Determination of intraluminal theophylline concentrations after oral intake of an immediate- and a slow-release dosage form. J Pharm Pharmacol 57: 987-996.
-
 Table 1
 -
Table 2
-
Table 3